Filter cigarettes VS Heated tobacco products
Per product. Heated tobacco product — THS; filter cigarette — reference 3R4F.
INDEPENDENT CATEGORY COMPARISON
Explore the real differences between product categories through structured data, independent sources and neutral explanations.
Difference identified
COMPARISONS
Every comparison is a table of measurements from an official report: the substance, how much on one side, how much on the other, and the difference.
Per product. Heated tobacco product — THS; filter cigarette — reference 3R4F.
Per 100 g. Milk with added vitamin D; soy drink unsweetened, shelf stable.
Per 100 g of drink. Both brewed with tap water, so the water itself is out of the comparison.
Per 100 g cooked. The white rice is enriched with B vitamins — visible in the thiamin and folate rows.
Per 100 g. Few rows: for olive oil the database has measured fatty acids, not vitamins and minerals.
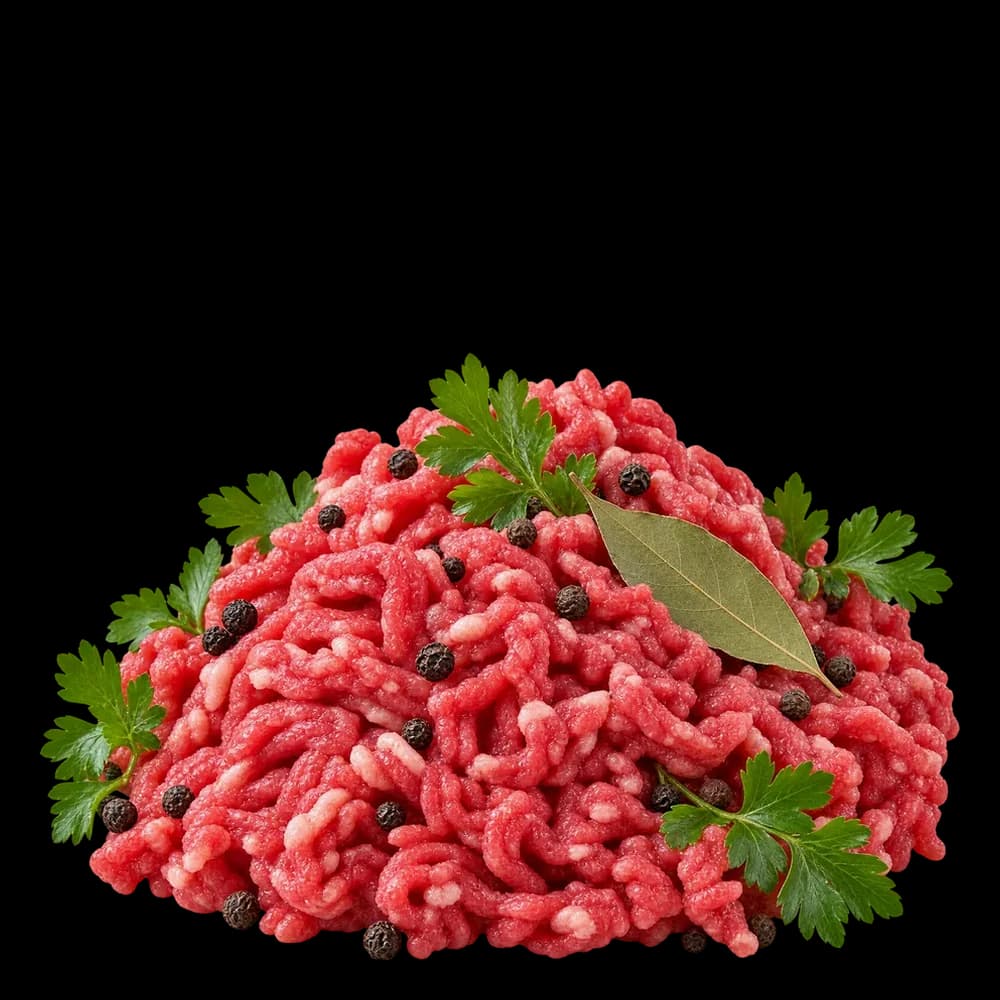
Per 100 g raw. Both are raw: cooking changes water and fat and would make the sides incomparable.
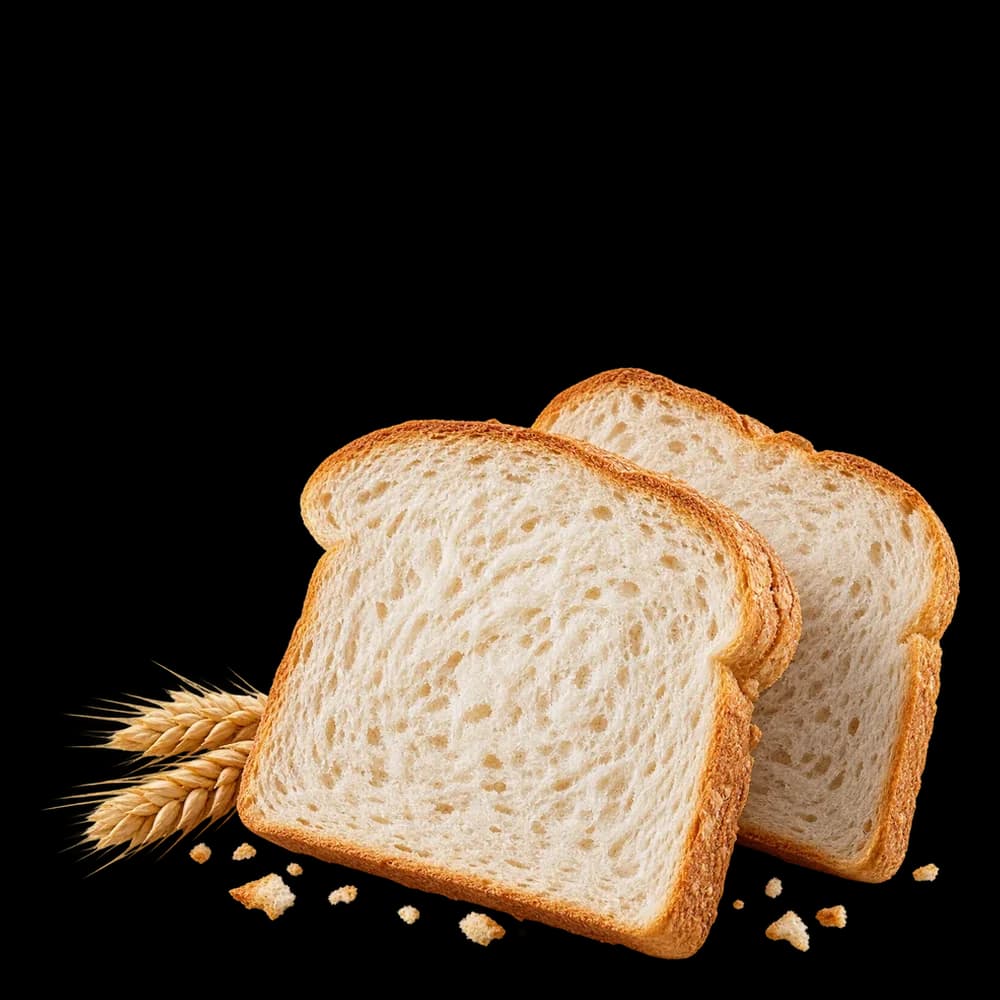
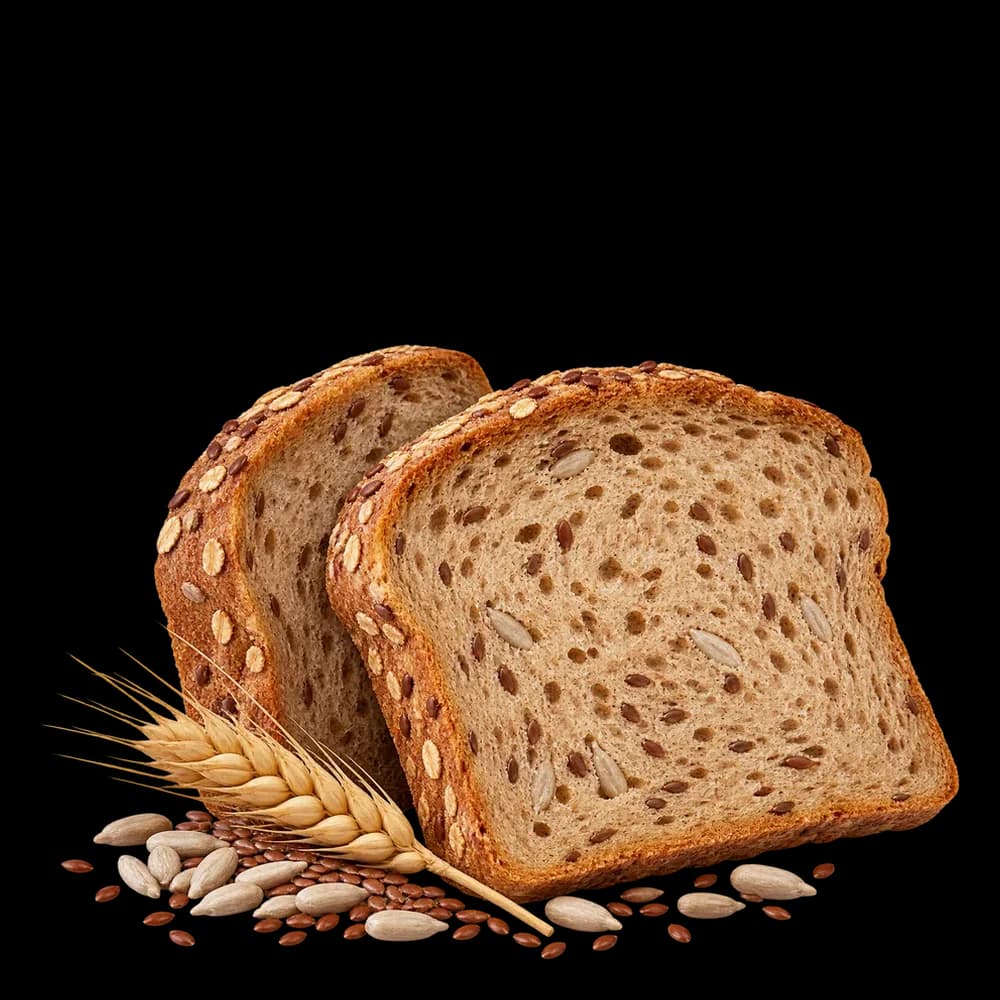
Per 100 g. Both commercially prepared: home-baked bread differs from recipe to recipe.
BUILD YOUR OWN
Only categories from the same family can be compared: they share properties, so the comparison means something. Pick the first and the rest will guide you.
HOW IT WORKS
The platform offers only categories that can be compared correctly — those from one family.
Both sides are examined against one structure of properties and carry equal visual weight.
Every material claim carries a source, a review date and its stated limitations.
CONTRAST names no winner and does not replace professional advice.
RESEARCH & UPDATES
Beverages
Microplastics in tap and bottled water: what the review foundA systematic review of studies from 2010 to 2024 reports a wide range of microplastic counts: tap water from 0.7 particles per litre in rural areas to 1753 in urban surface water, bottled water up to 8934 particles per litre for the 1–50 µm range. The authors attribute the high bottled-water figures to packaging degradation.
Beverages
Nutritional profile of plant-based drinks and cow’s milk: 96 products by one methodThe study compares 96 plant-based drinks from the Colombian market with cow’s milk using the Health Star Rating method. The differences sit in protein, added sugars and calcium; skimmed milk ranked highest overall, then whole milk, and among plant-based drinks soy and cashew.
Beverages
A review of habitual coffee consumption: where associations are strong, and where they are qualifiedThe review gathers data linking habitual coffee consumption to cardiovascular, metabolic and organ-specific outcomes. The strongest associations are described for moderate intake — three to four cups a day, roughly 450–600 ml — and the relationship is characterised as J-shaped.
OUR EVIDENCE STANDARD
We show the structure behind every meaningful statement — and the limits of what is currently known.
The source sits beside the information it supports.
Studies, agency positions and reviews are visually distinct.
Insufficient and outdated information is given a status.
Advertisers have no influence on the content of comparisons.
Game module
The game shows what happens to the composition under heating and burning: a walkthrough, a six-capsule round and a short quiz.
WHERE WE STAND
Most comparison services try to name a winner. CONTRAST shows the structure of the difference, the evidence behind each claim and the limits of what is currently known.

TWO CATEGORIES · ONE QUESTION
Suggestions are reviewed by the editorial team and published when reliable comparable evidence is available.