Composition in numbers
Filter cigarettes VS Heated tobacco productsPer product. Heated tobacco product — THS; filter cigarette — reference 3R4F.
COMPARISONS
Every comparison is a table of measurements from an official report: the substance, how much on one side, how much on the other, and the difference.
Composition in numbers
Filter cigarettes VS Heated tobacco productsPer product. Heated tobacco product — THS; filter cigarette — reference 3R4F.
Composition in numbers
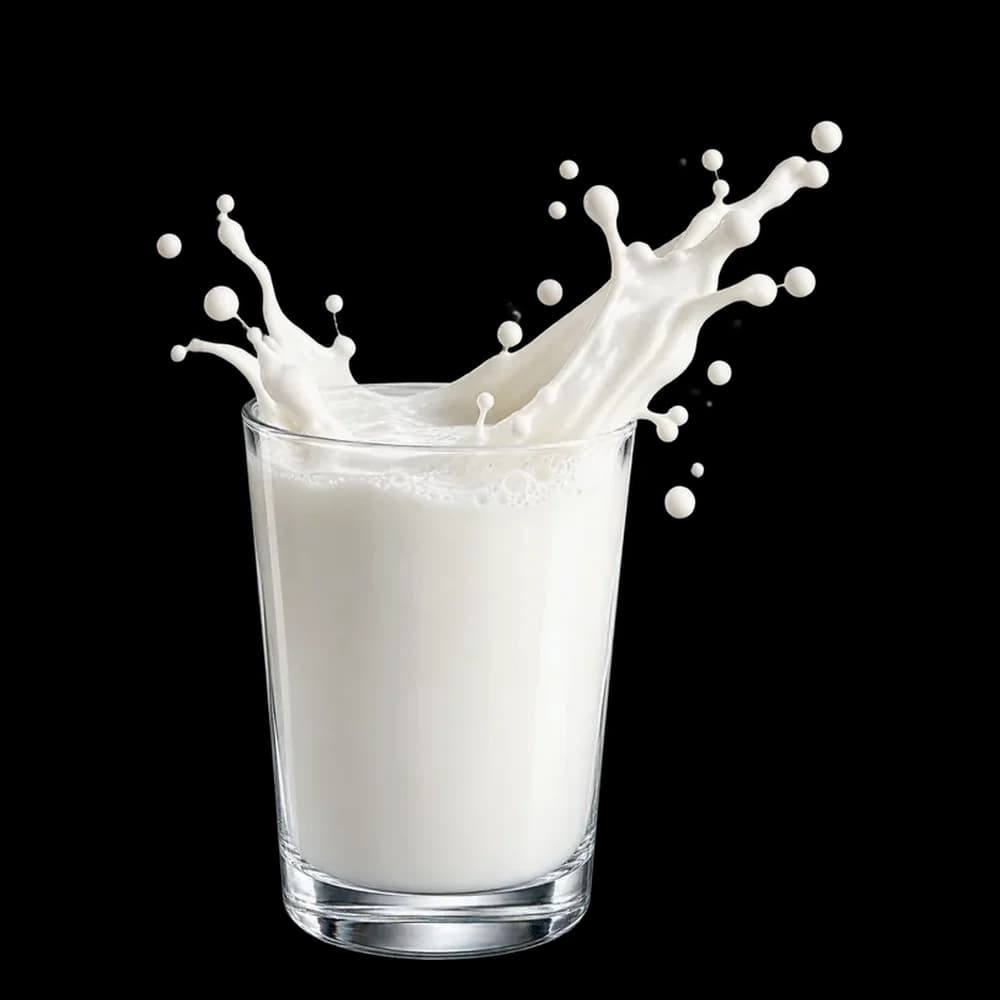
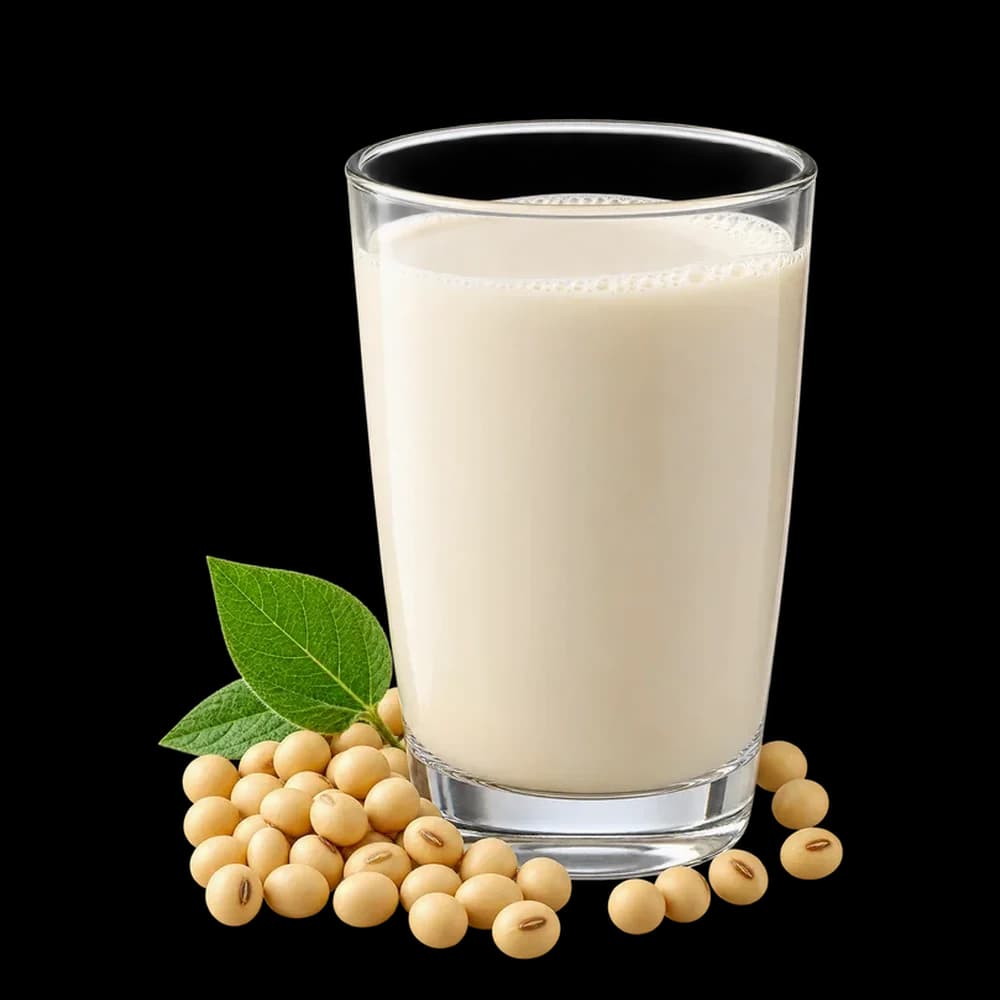
Cow milk VS Soy drinkPer 100 g. Milk with added vitamin D; soy drink unsweetened, shelf stable.
Composition in numbers
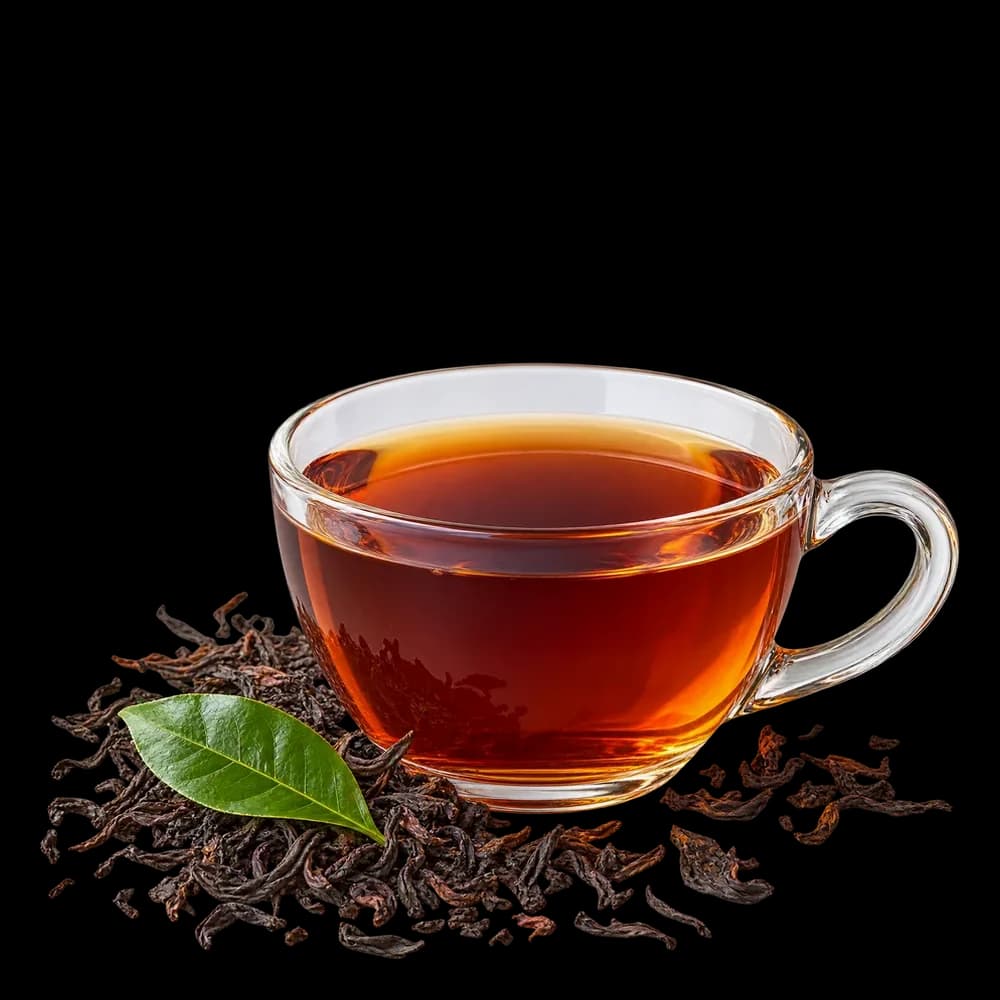
Brewed coffee VS Brewed black teaPer 100 g of drink. Both brewed with tap water, so the water itself is out of the comparison.
Composition in numbers
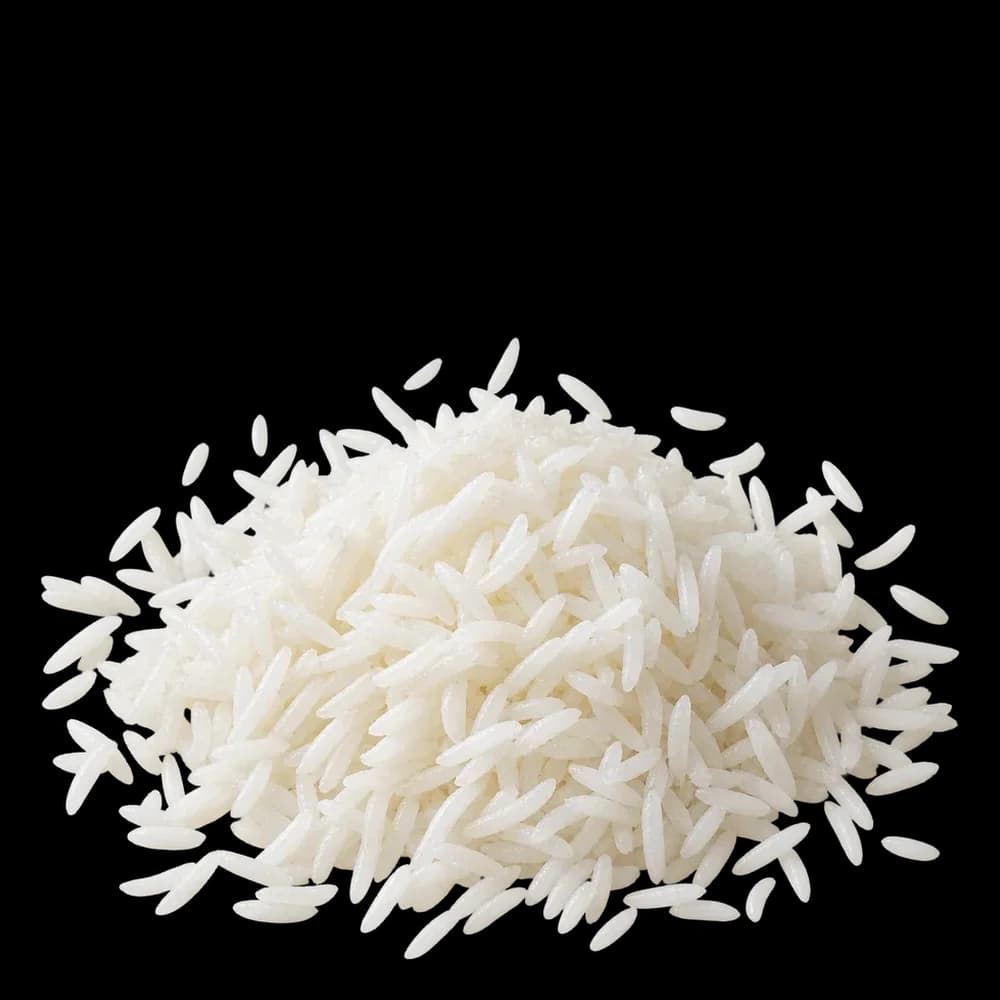
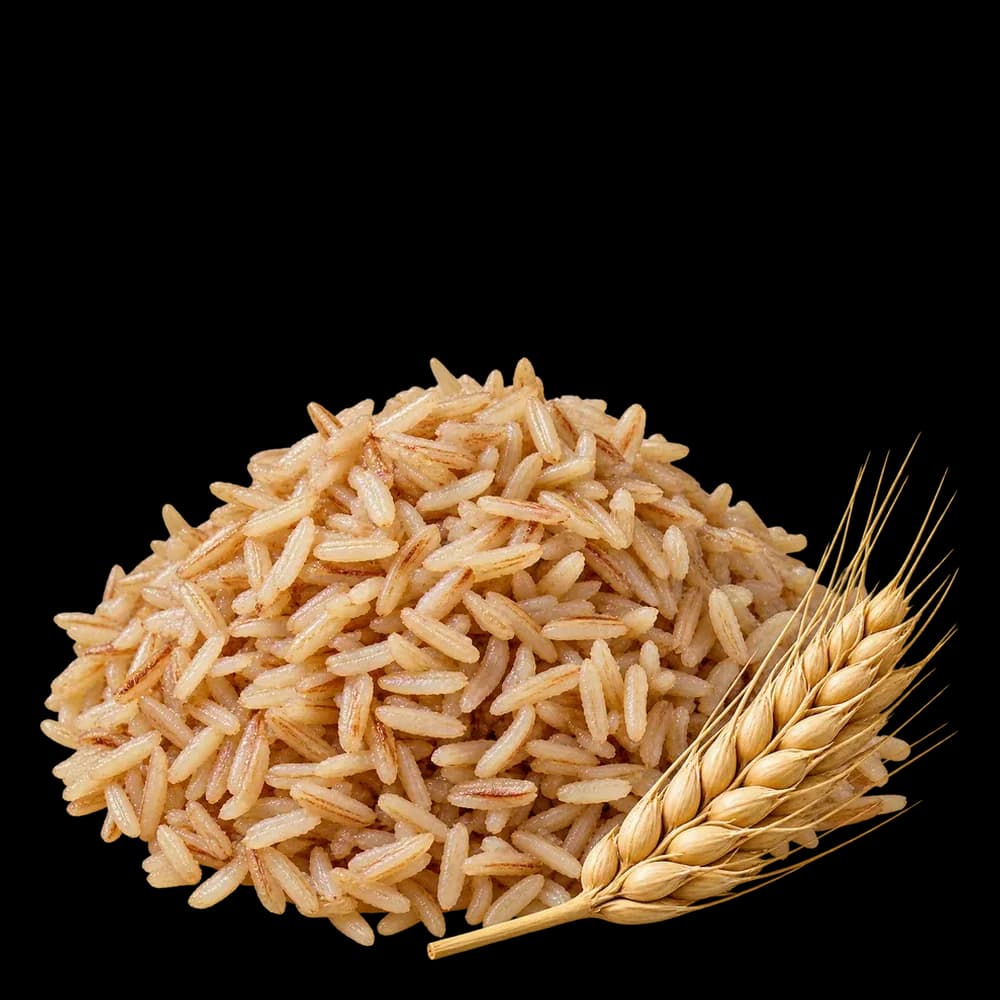
White rice VS Brown ricePer 100 g cooked. The white rice is enriched with B vitamins — visible in the thiamin and folate rows.
Composition in numbers
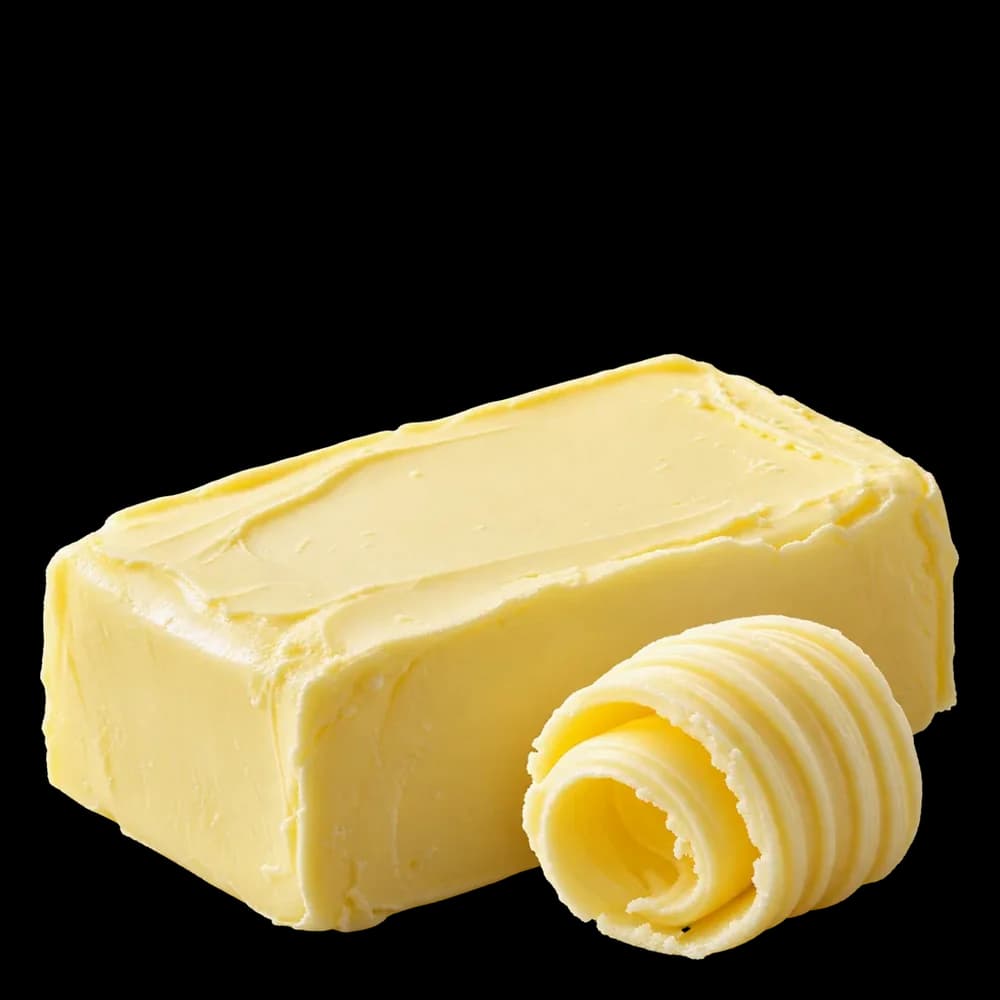
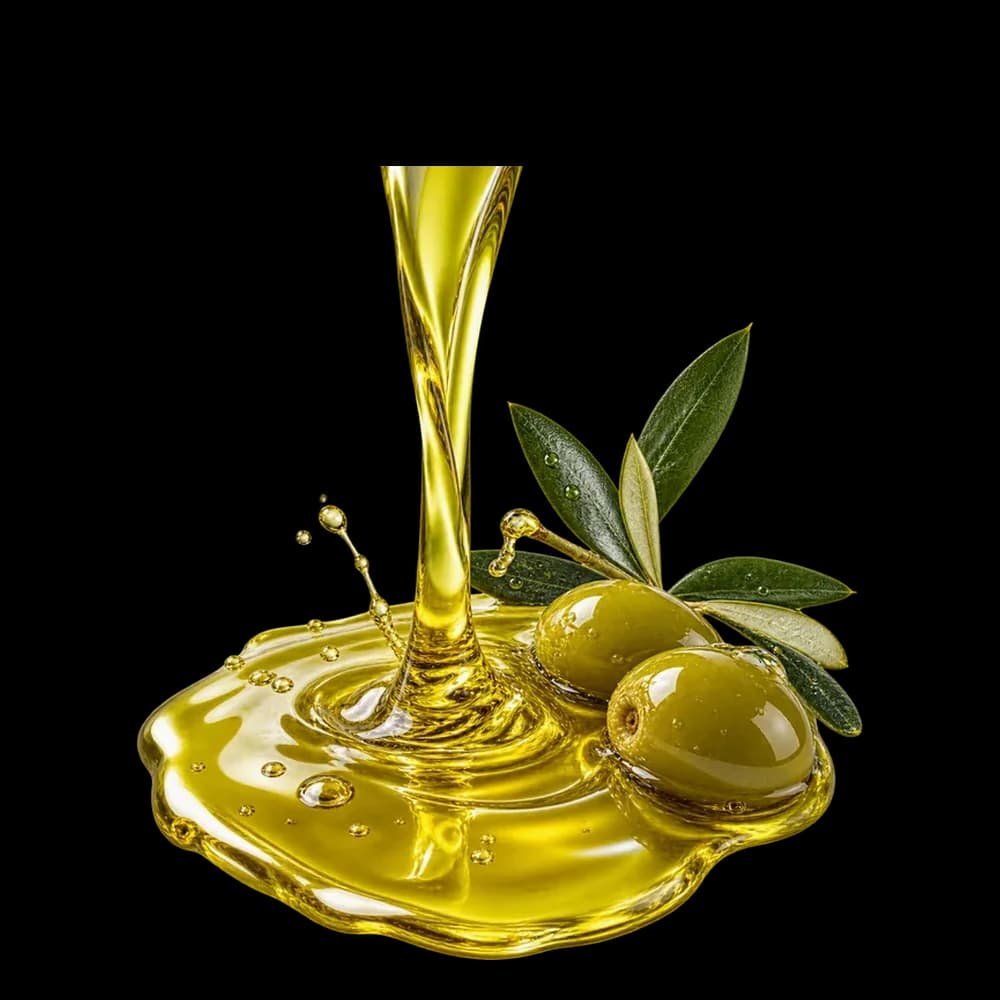
Butter VS Olive oilPer 100 g. Few rows: for olive oil the database has measured fatty acids, not vitamins and minerals.
Composition in numbers
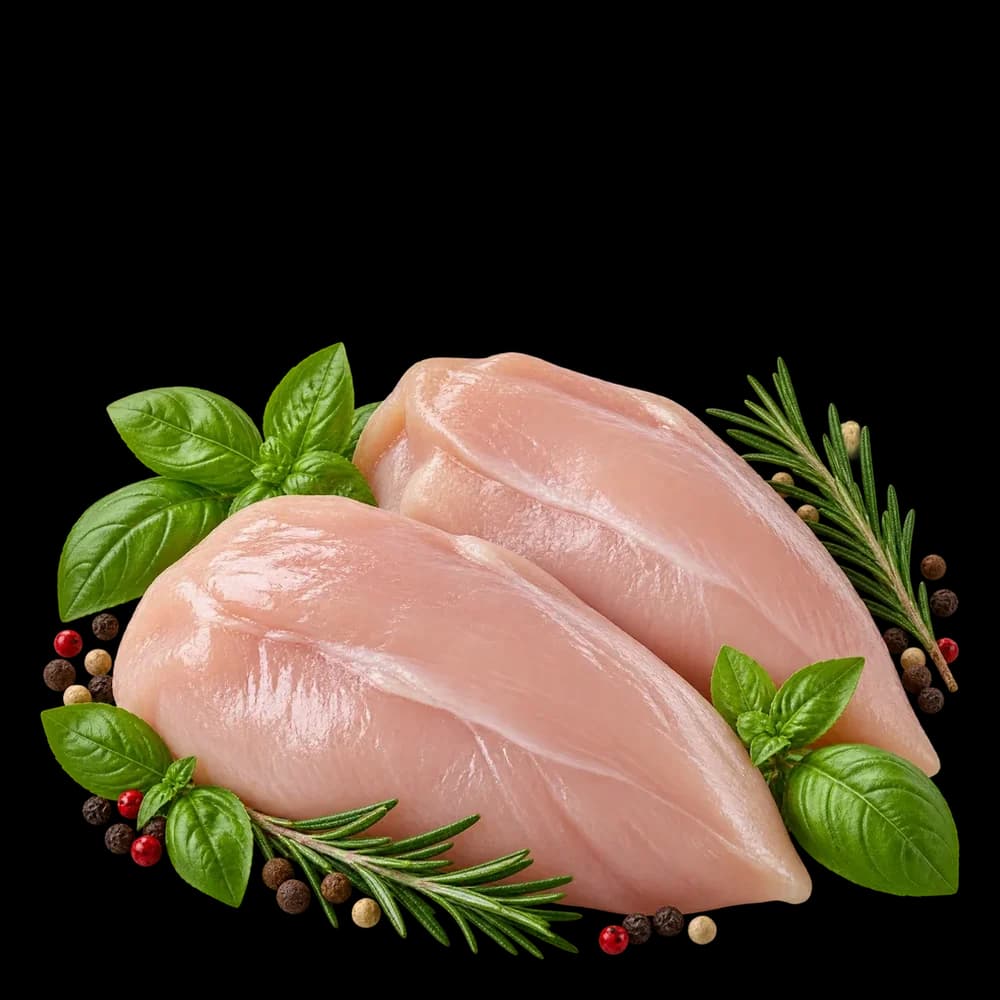
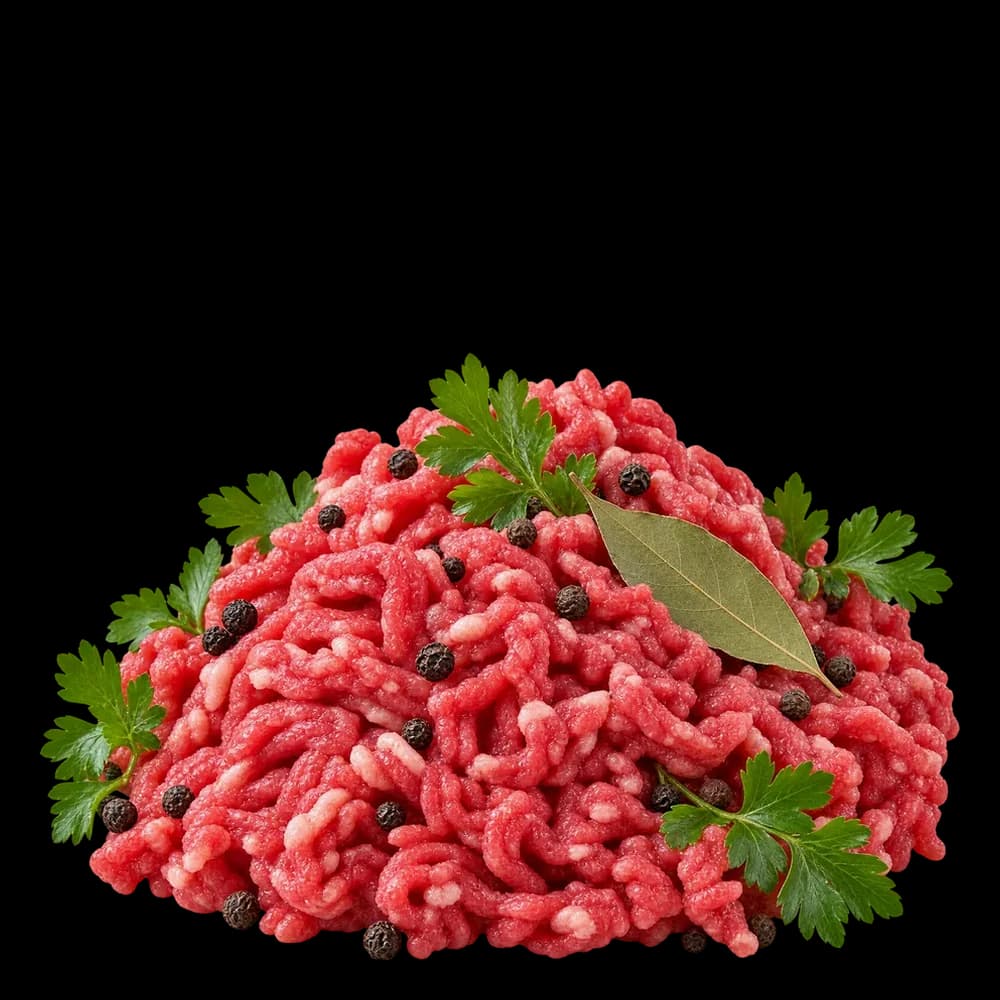
Chicken breast VS Ground beefPer 100 g raw. Both are raw: cooking changes water and fat and would make the sides incomparable.
Composition in numbers
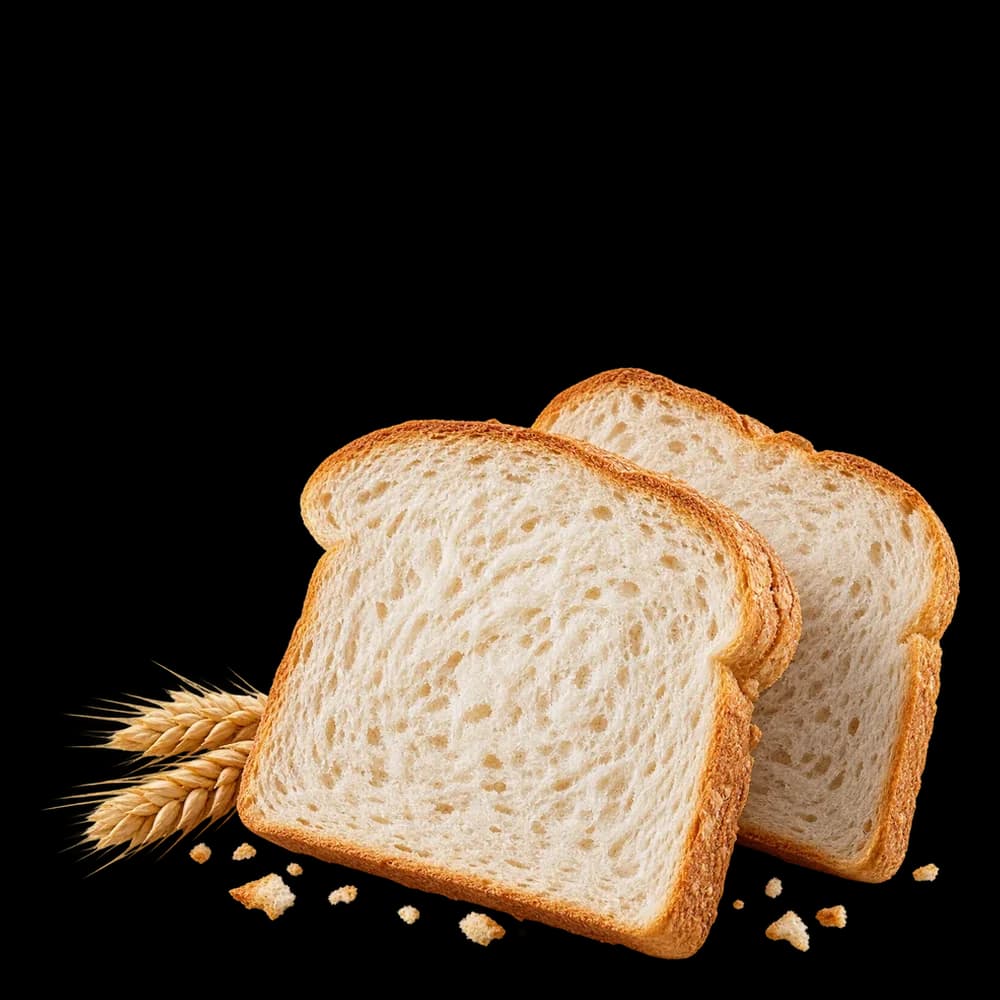
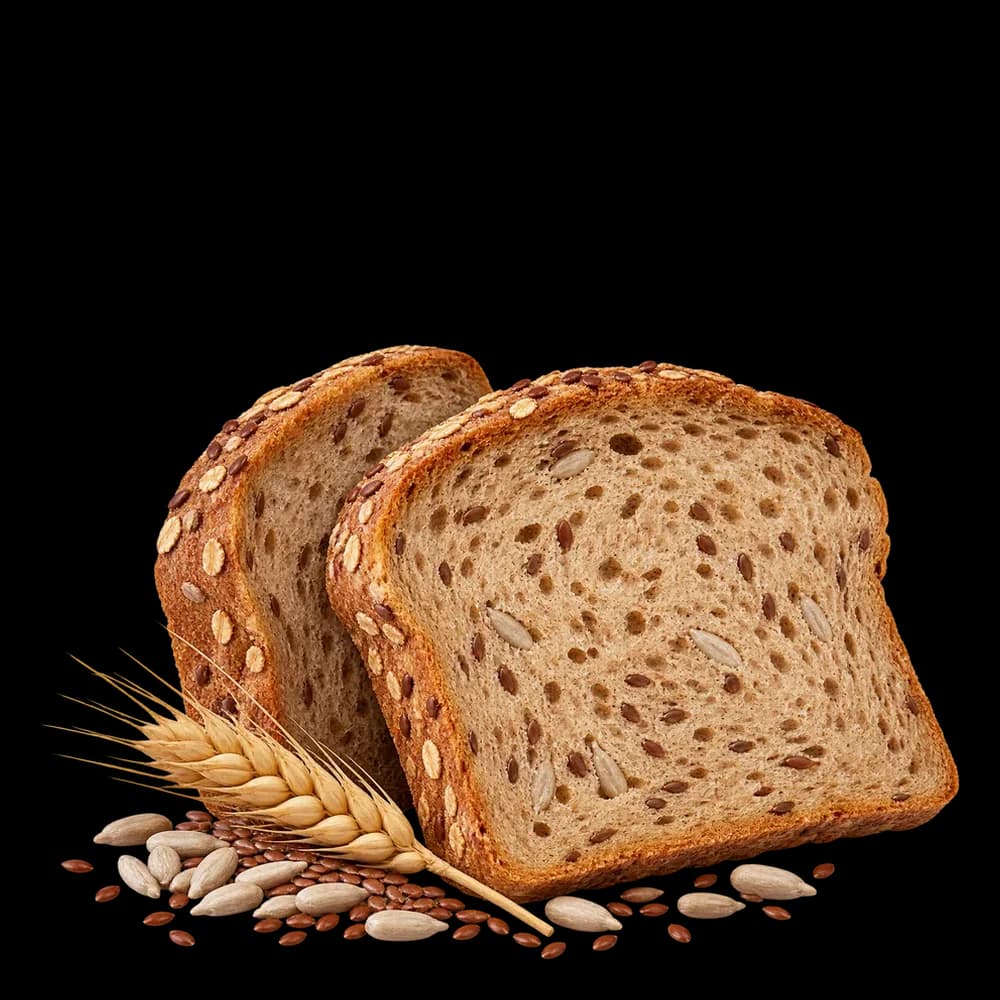
White bread VS Whole-wheat breadPer 100 g. Both commercially prepared: home-baked bread differs from recipe to recipe.